

In my last blog I wrote about the pattern of a core data flow which evolutes from the BI core definition from the 90’s. We also have seen a tradition BI example on SQL server with STG, DWH and DM concepts.
Now it’s time to look broader. Look what’s happening more in de data field. In the market. At clients. Everywhere.
Data Science
Let’s dive into the Data Science lifecycle. Before I started my career, I studied econometrics. A common role that comes from this background is the Data Science consultant. Econometrics closely relates to data science, providing a strong foundation in statistics, regression, and causal inference. During my studies, I had never heard of BI or Data Science as a job or role, but it came along the way.
As a Data Scientist, you should be familiar with the Data Science lifecycle. It describes the end to end process of transforming raw data into valuable insights or predictive models. This lifecycle is a familiar pattern and looks like this.
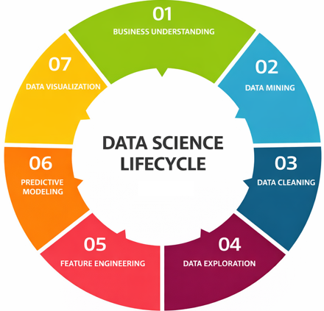
The Data Science lifecycle starts with defining the business problem and understanding what you want to achieve, just like with Business Intelligence.
Next, data is collected, cleaned, and explored to uncover patterns or issues. Models are then built (engineered), trained, validated, and improved through iteration. Finally, results are deployed, monitored, visualized, and refined to ensure real world impact.
This pattern actually looks quite similar to the original BI definition. The sentences can also be mapped onto this lifecycle. If we transform the lifecycle into a data flow, we end up with the following:

Which is a Data flow from Source data to Business value, driven by Data Science steps! Really interesting. Let’s dive into another.
Snowflake Platform
During my career, I have worked with multiple clients across different industries and technologies. My main experience is in the Microsoft ecosystem, but I have also worked on implementations in AWS and with Snowflake.
At one of my clients using Snowflake, we discussed the ingest, storage, processing, and serving layers of their data platform. This is another way to represent data, and it looks like the following.
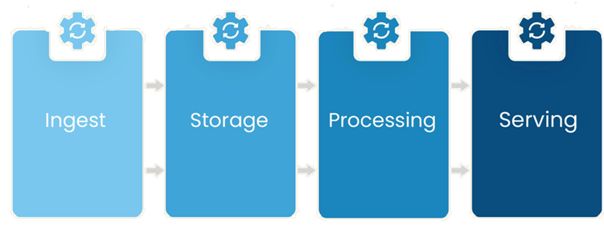
What stood out to me is that this is essentially a data flow, very similar to the traditional Business Intelligence data flow. Data moves from ingestion to storage, then to processing, and finally to serving, where it becomes available for reporting, analytics, or data science use cases.
Just like in BI, this layered approach describes the same journey, only from a more technical perspective. Different terms are used, but the underlying pattern remains the same: moving data forward, refining it step by step, and ultimately turning it into something valuable. So the below data flow looks familiar right?

AWS Data platform
Last example: at an AWS client, I worked with S3 buckets as the main storage layer. According to AWS documentation, this is a common data platform architecture, and it was also used at that client at the time.
In this setup, ingested data is first stored in a Raw bucket. The data is then cleaned and validated into a Cleansed bucket, after which it is modeled and transformed in a Curated bucket. Finally, the data is exposed through a Consumption layer for reporting and analytics.
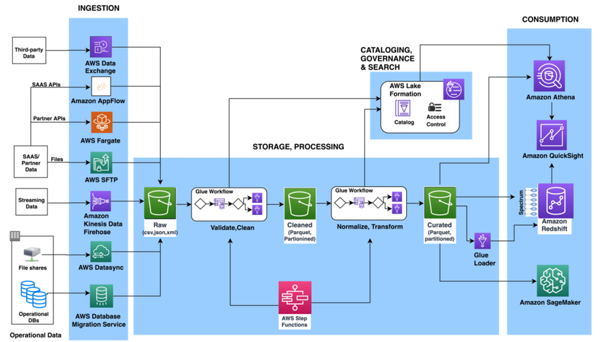
Again, this represents a data flow, very similar to the BI data flow. Data moves step by step from raw input to usable insights, following the same underlying pattern of refining data into value. Raw, cleansed, curated consumption is therefore again a different representation of the data flow.
Do you want to know why?

Compare Data patterns
Let’s compare the data patterns we have so far.
From our previous blog, we have the traditional BI data flow with STG, DWH, and DM [1].
Now we add the flows from the Data Science lifecycle[2], the Snowflake example[3] and the AWS architecture [4]. I If we place them underneath each other, we get the following.
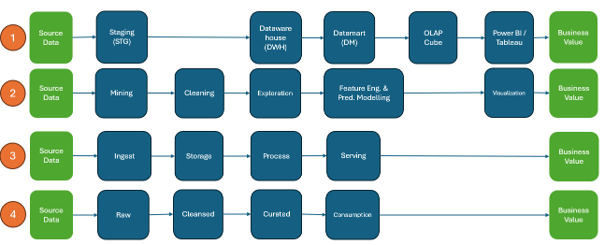
Wow, this looks familiar!
When comparing these patterns, we can identify at least three groups that keep coming back, every time. Does that look familiar?
It definitely resembles a well-known pattern. Maybe we are all doing the same thing after all? Or are we? And what can we learn from this? How are these patterns really connected?
You’ll find it out in my next blog!